Social Media Report
There are several main components which comprise the social media background report (social media report). What is included in your background report is largely driven by the profile settings used when the background check was performed and the background report settings.
If you are running checks yourself, you will need to review the results of a background check for accuracy and redress flagged posts. You should refresh your report when you’re done to see the most up to date information.
If you have Analyst Assistant, then you will only receive a report once all flagged posts are already redressed and the analyst marks the subject as Redressed. You will see a green check mark badge on the subject for those subjects reviewed by a human analyst.
In this article we’ll break down the different pages and information you may see in your report.

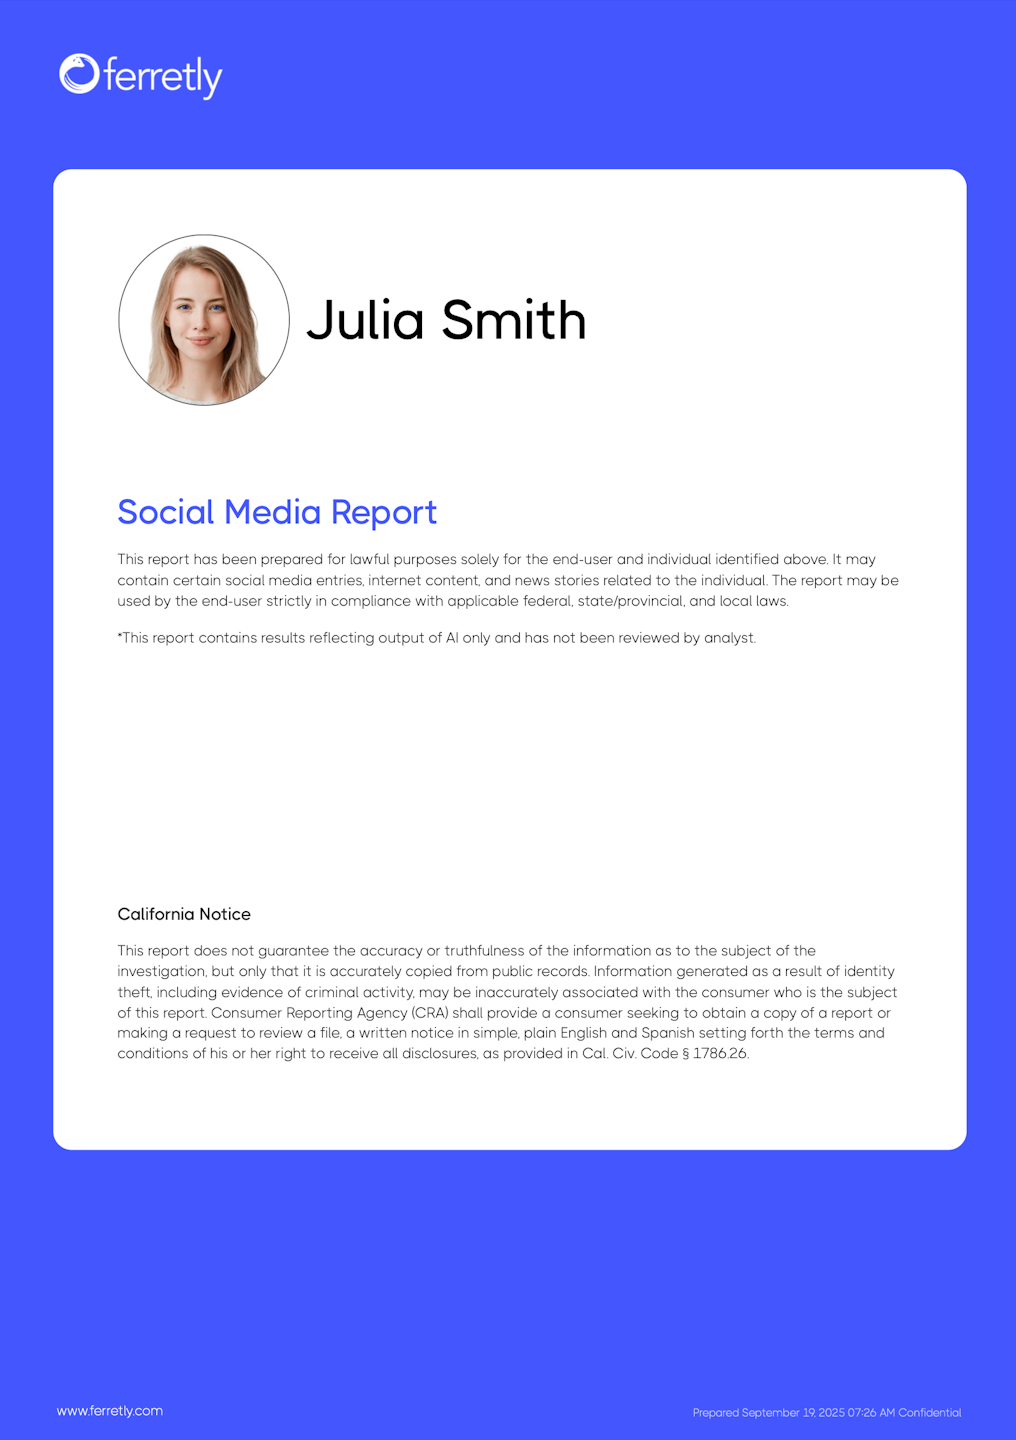
Report Cover Page
Includes full name and subject profile picture from one of their associated social media profiles. You will also see a disclaimer as to whether or not the report was reviewed by a human analyst. If FCRA setting or custom disclaimer was checked, a report addendum is included.

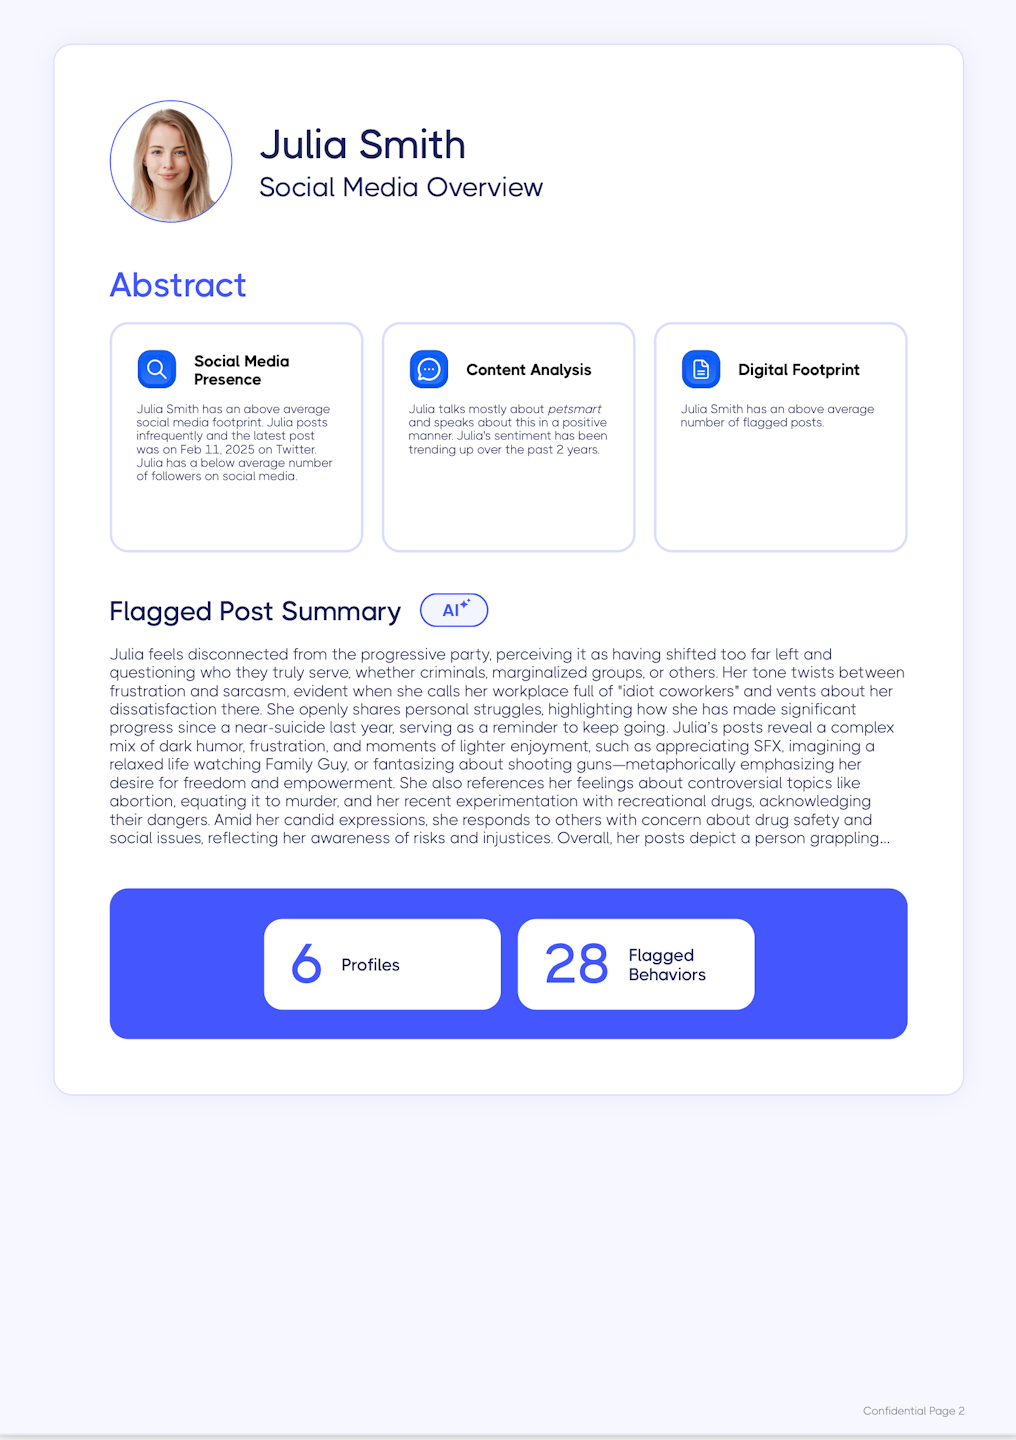
Subject Summary/Abstract
This optional page will provide an overview of the subject's social media presence including follower/following counts, post counts and frequency, sentiment trends, and what they discuss most often online. It will also include a count of their social media profiles, web/news posts, and flagged posts. Lastly, an AI generated flagged posts summary is included if the subject has original posts or replies that have been flagged.

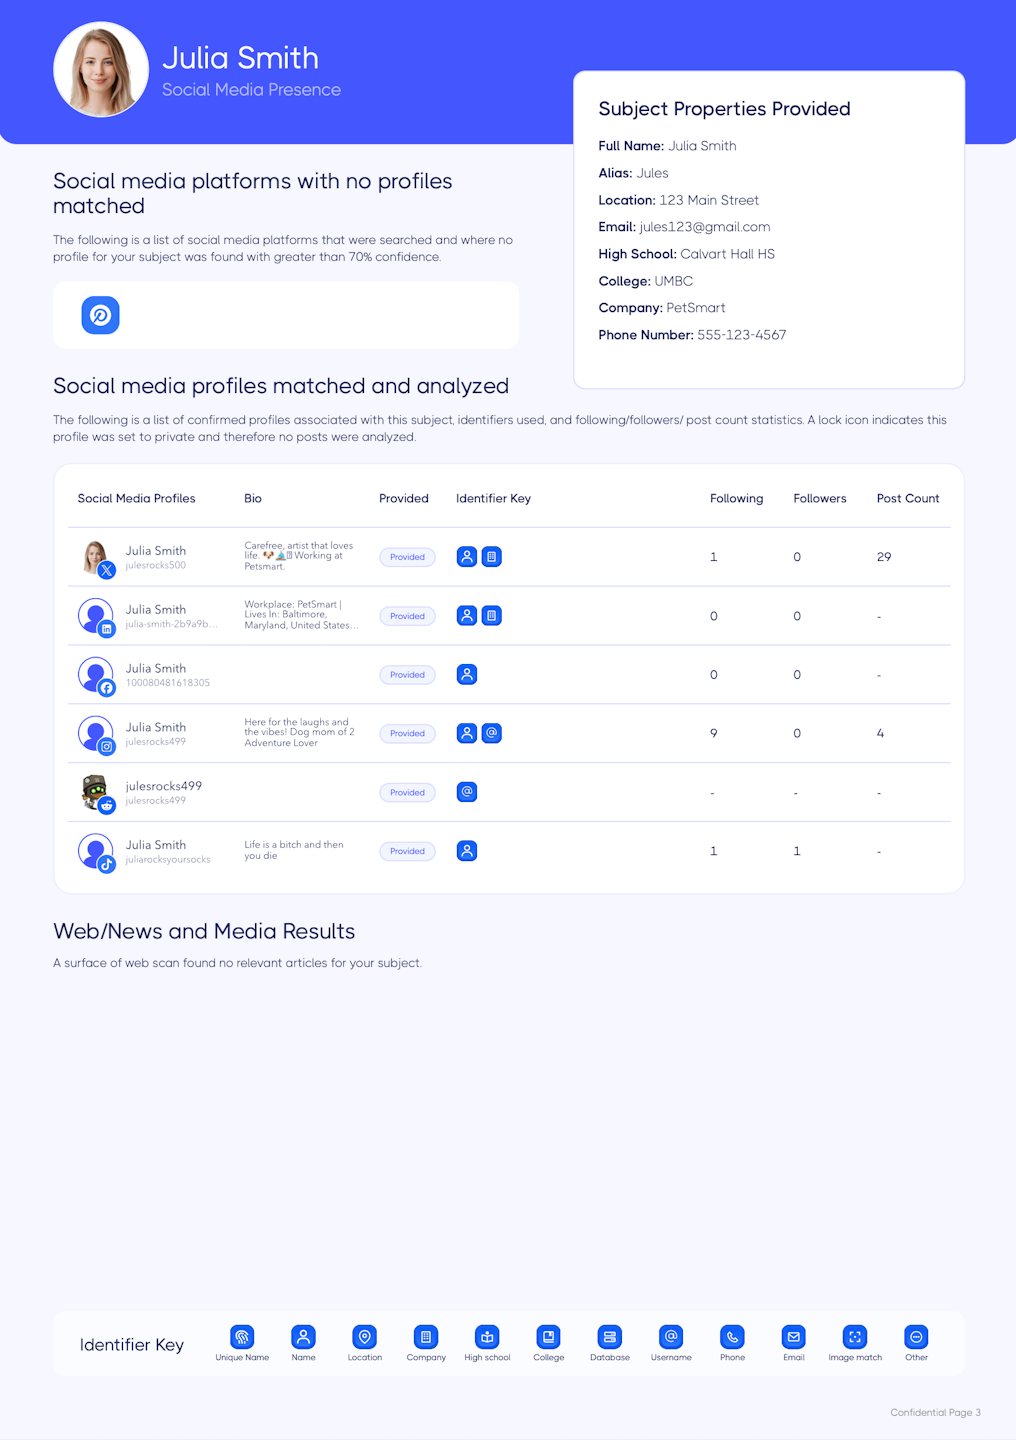
Social Profiles
The social profiles page will show the subject properties provided, indicate the social media platforms searched and analyzed by Ferretly, and count of both web and news results. For each associated social media profile it includes the match criteria (identifiers) used.

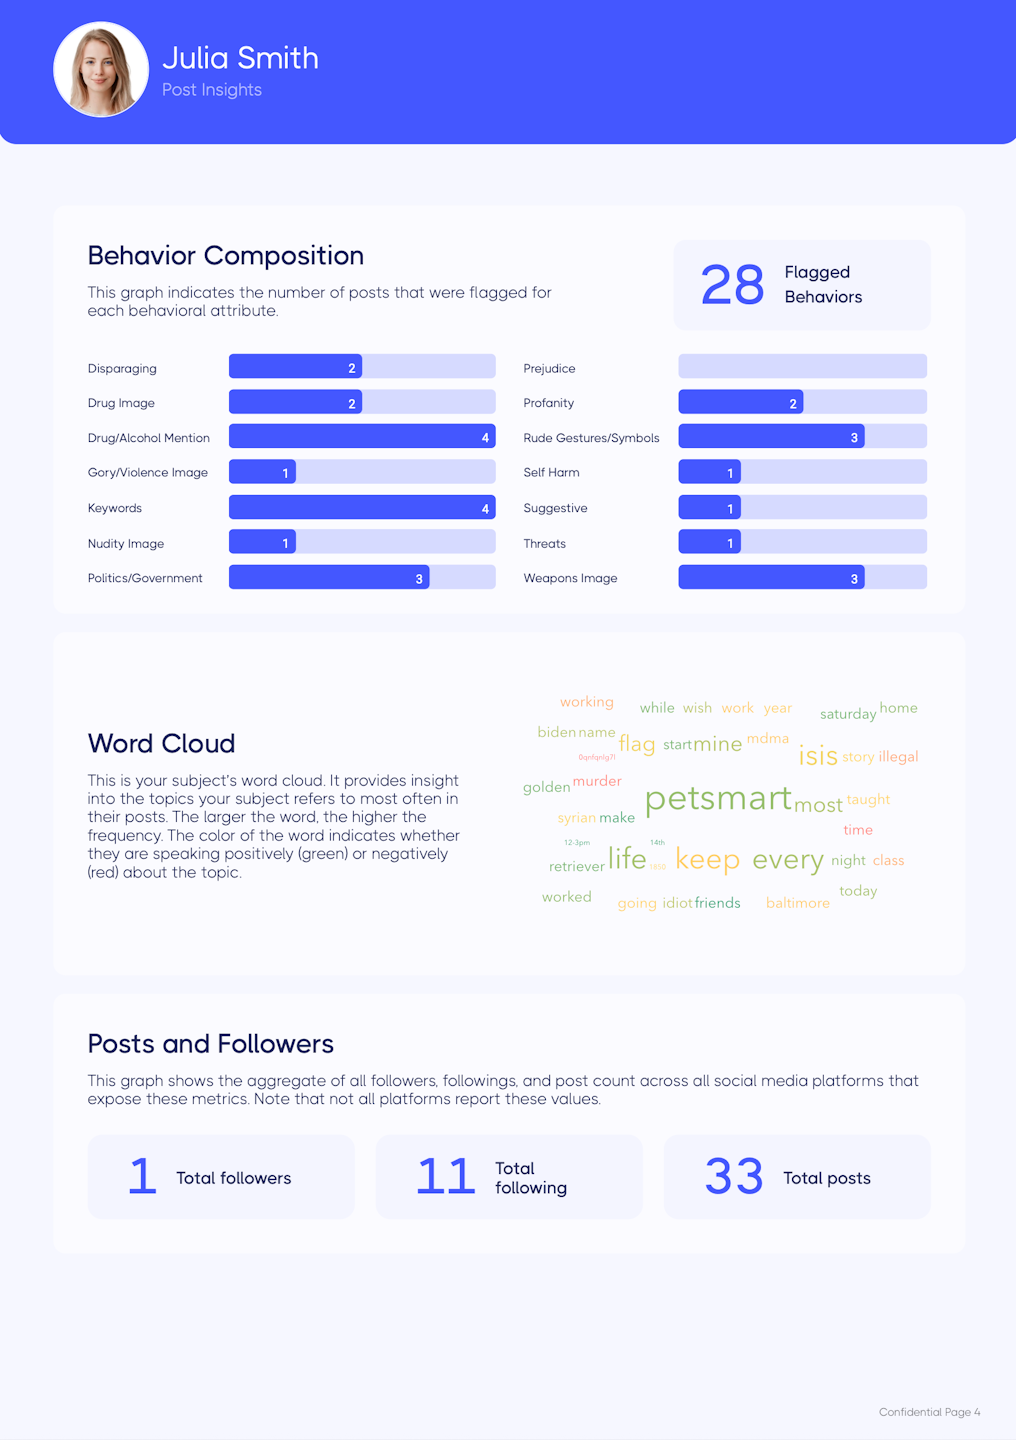
Post Insights
A one or two-page summary providing key insights into the subject's posts. There are several different sections for the insights pages.
Score - A measure that combines sentiment and the number of flagged posts related to all the subject's social media accounts. Remember, the score does not represent overall risk and should only be used to compare candidates consistently. For more information on subject scores, see our article here.
Behavioral Composition - A summary of flagged posts categorized by behavior.
Word Cloud - A graph which represents words or phrases in various sizes along with colors from red to green. The size of the word represents frequency of use across all posts and color represents the degree of negative sentiment (red) to positive sentiment (green).
Sentiment Over Time Graph - A graph located below the word cloud that shows the average sentiment of all posts over a period of time. The y-axis represents the sentiment and the x-axis is intervals of time. The color of the line also indicates the sentiment: red indicates a negative overall sentiment, while green signifies a positive overall sentiment. A downward trend in the line suggests a shift towards negative sentiment, which may reflect the individual's mental well-being.
Channel Volumes - An overview of how many posts the subject made on the different social media platforms.
Follower/Following Counts - An aggregate of all followers, followings, and post counts across all of the subject's social media platforms. Note that some platforms do not include post counts or follower/following counts.
OCEAN Personality - The subject's personality insights based on the OCEAN (Big Five) model. It provides an estimated profile of a subject's personality traits based on their social media posts. The OCEAN framework, a widely recognized psychological model, assesses the five dimensions.

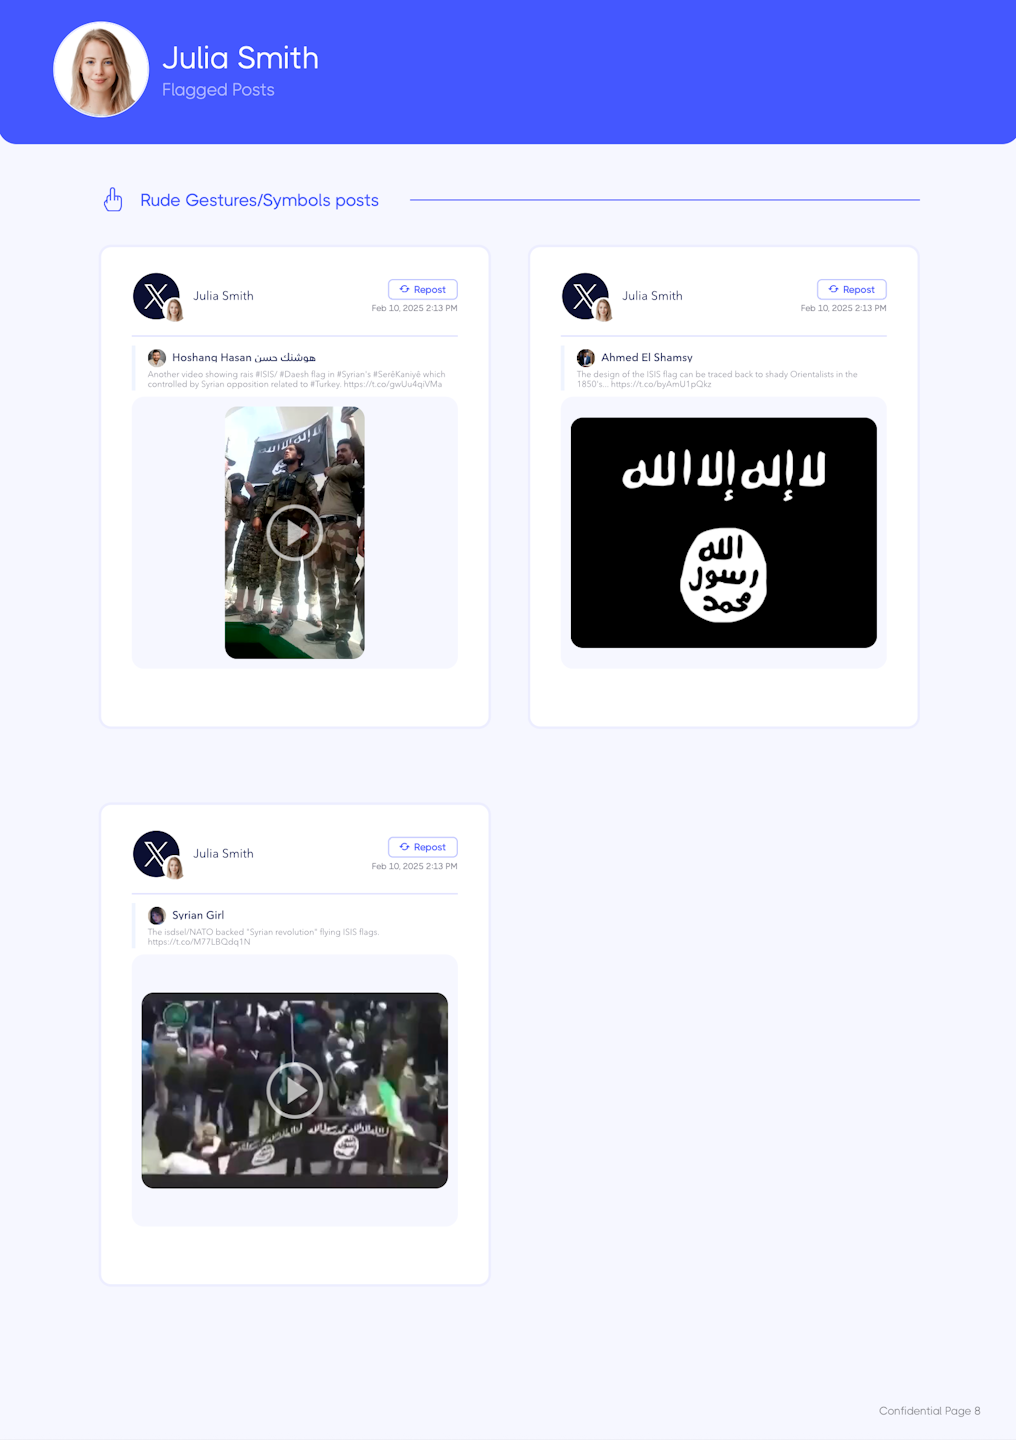
Flagged Posts
A list of flagged posts organized by post date chronologically (by default), with four posts per page. There can be two additional sections of flagged posts for keyword flagged posts and web/news posts. You can change how flagged posts are organized in report settings. Your choices are chronological, by platform, or by behavior.
Keyword Flagged Posts
A separate section showing flagged posts based on custom keywords used in the background check settings.
Web/News and Media Posts
A list of relevant web and news articles about the subject, sorted chronologically.

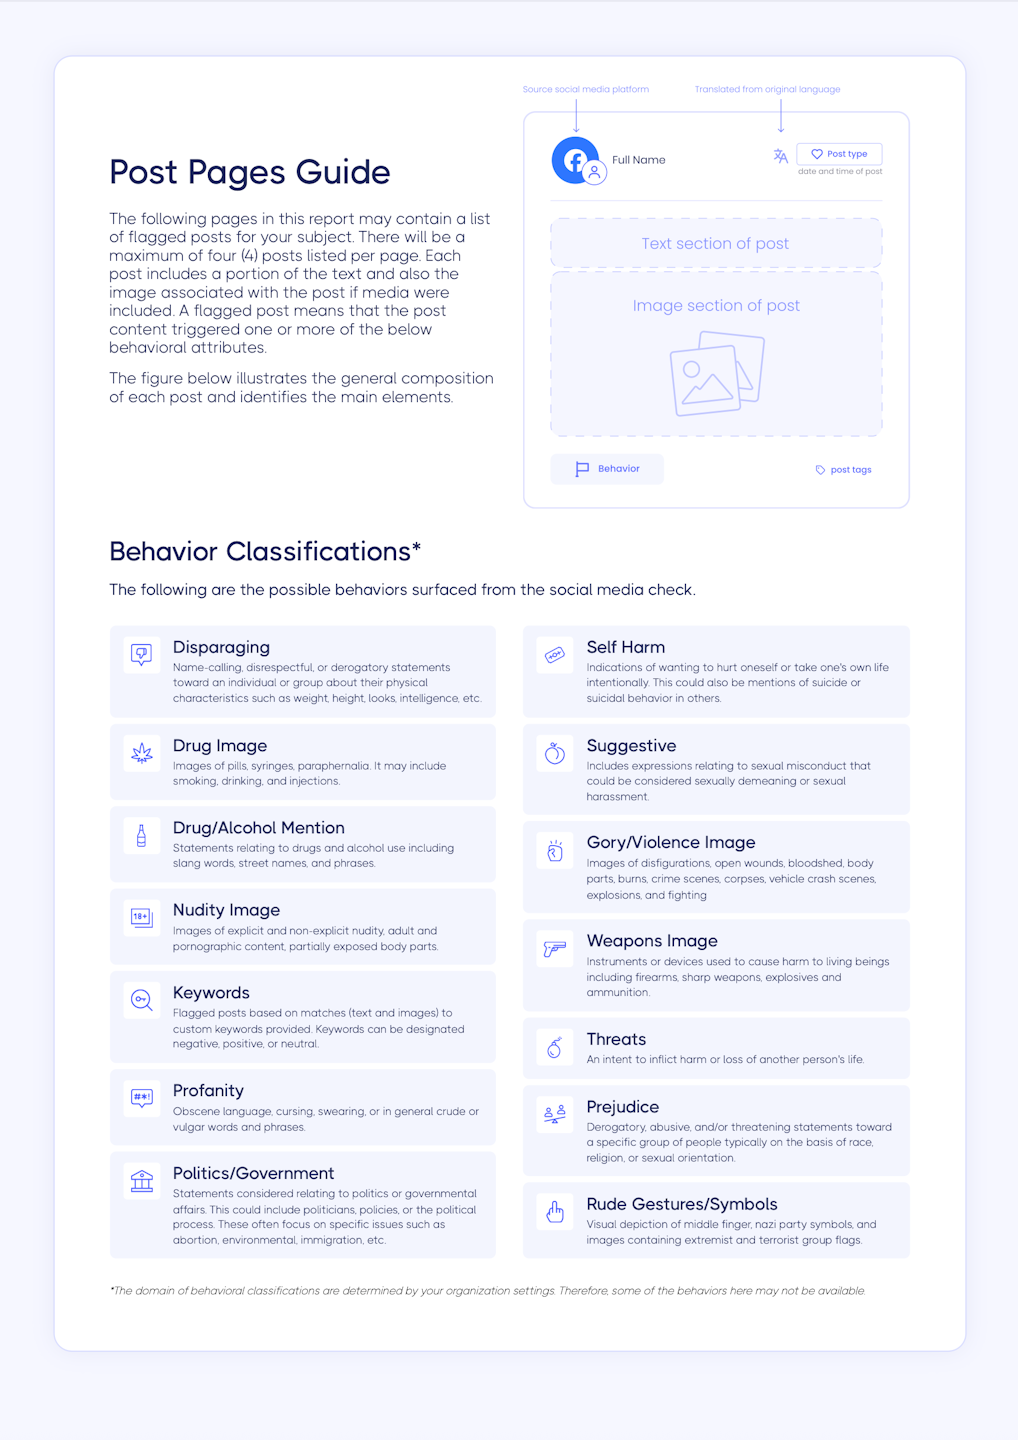
Post Pages Guide
If Show Help Pages was checked in the settings profile, this provides a key to reading each post and helps users understand the icons and flag types in the report.
